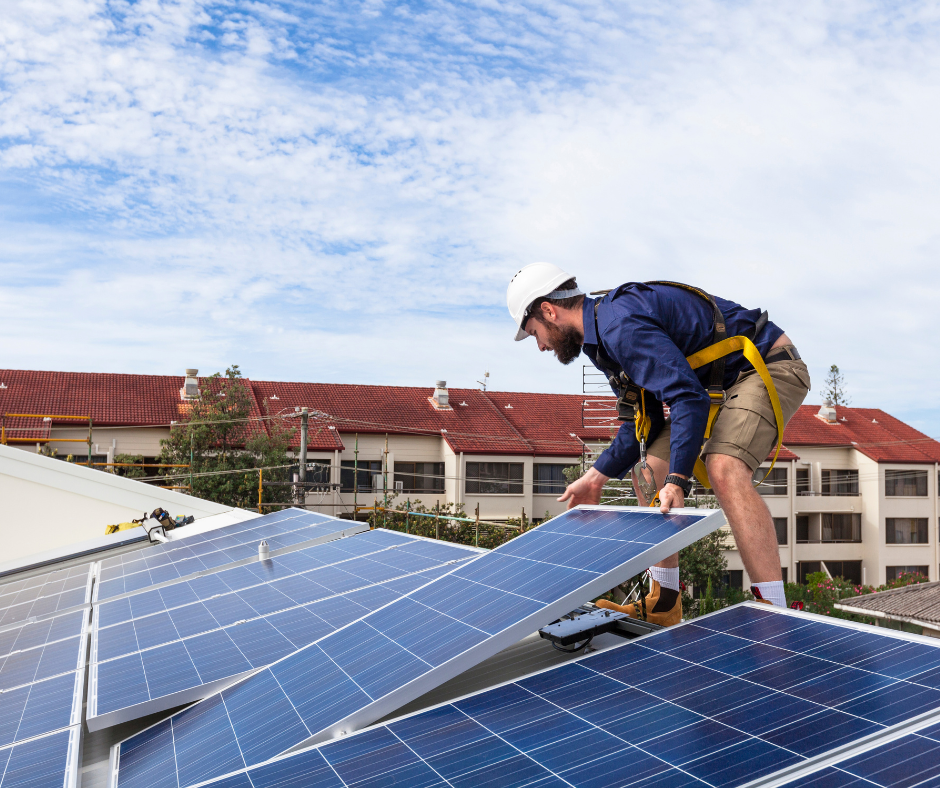
A new map that can help homeowners who are considering installing solar panels is now available to view on the Herefordshire Council website.
Herefordshire currently imports 87% of its electricity, costing homeowners, businesses and organisations approximately £200 million per year. 'Growing our own' electricity in Herefordshire, through solar or wind power for example, would reduce the amount of money leaving the local economy, and help cut carbon emissions.
The new mapping tool includes a solar map which provides figures for the energy generation potential of solar PV panels on a building’s rooftop. The figures are available following aerial scanning of properties in the county which has produced information on the size, pitch and aspect of roofs and this is used to calculate the solar energy generation potential.
The map can also be used by developers, landowners and property owners interested in renewable energy development and installations as it sets out where this is not possible in the county due to known constraints, for example due to nature conservation and heritage value or where there are practical barriers to development. Identifying these constraints early within any development proposal is encouraged, and the new mapping tool brings together this information in a clear format, so it is easy to identify.

Cllr Swinglehurst, Cabinet Member for the Environment, said:
“Generating renewable energy can significantly contribute to reducing emissions and reaching net zero. Understanding where in the county is right for the development of renewable energy technology is essential. Generating energy locally will allow landowners, community groups and businesses to reduce emissions and bring down their energy costs, benefiting our communities and economy.”
While the map shows where renewable energy development is not possible due to known constraints, it is important to recognise that this does not mean that all other areas are suitable and any proposal may be subject to planning permission. There have been no changes to existing planning policy.
If you would like more information or to view the maps visit our website.
Access to map tools:
For Solar - herefordshire.gov.uk/solar-constraints
For Wind - herefordshire.gov.uk/wind-constraints
Additional information
Herefordshire produced 119,576 MWh of renewable electricity (2023, most recent data) Regional Renewable Statistics - GOV.UK
With a total county demand of 866,435 MWH (2022, most recent data) Total final energy consumption at regional and local authority level: 2005 to 2022 - GOV.UK The County generates only 13% of its electricity demand.
The electricity imported is 746,859 MWH, at a current domestic retail price of 27.03p/kWh Changes to energy price cap between 1 April and 30 June 2025 | Ofgem has a value of £201,875,988 per year.
